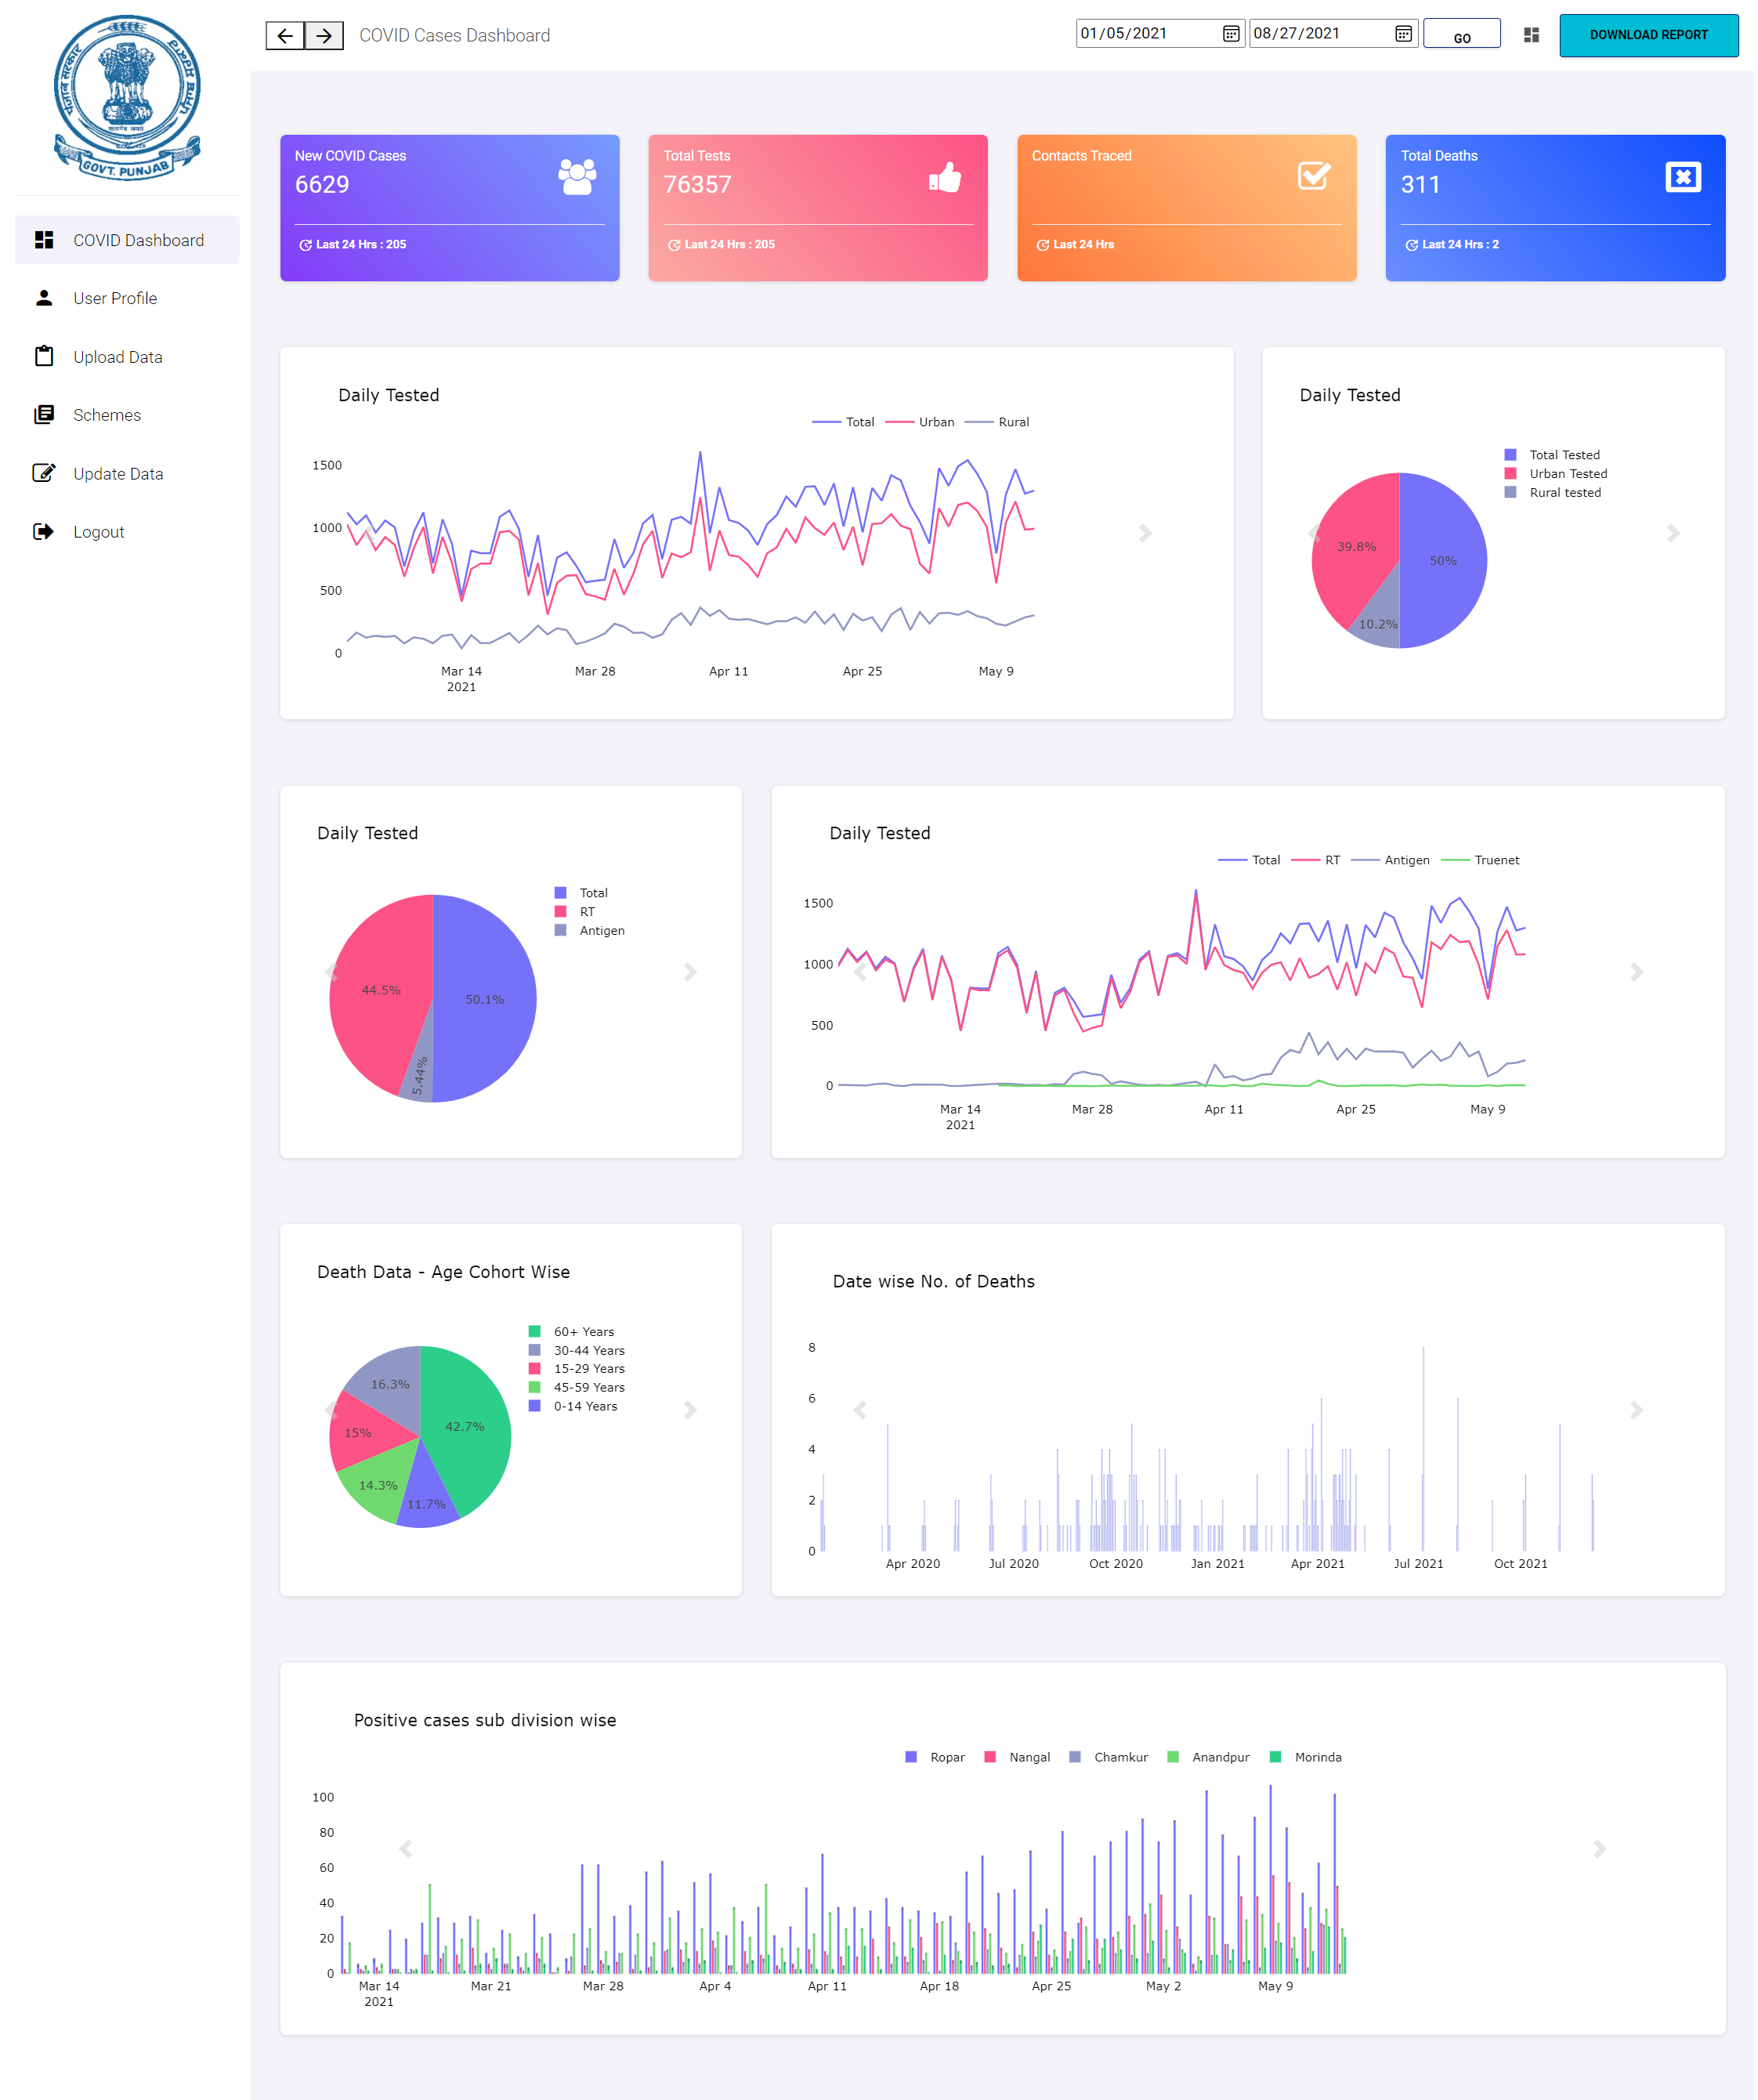
22 x 7 Plotting Dashboard
The DC offices of the state of Punjab require insightful plots for the graphical representation for comprehensive analysis of distrcit level data corresponding to multiple departments. Currently, the data is plotted weekly to generate a report for administrative purposes. The process is time consuming and is carried out manually at regular intervals for a particlar set of data.
Our team of four, developed a data analysis dashboard with real time
data plotting and statistical analysis for various departments' and schemes' data sheets under the DC Offices.
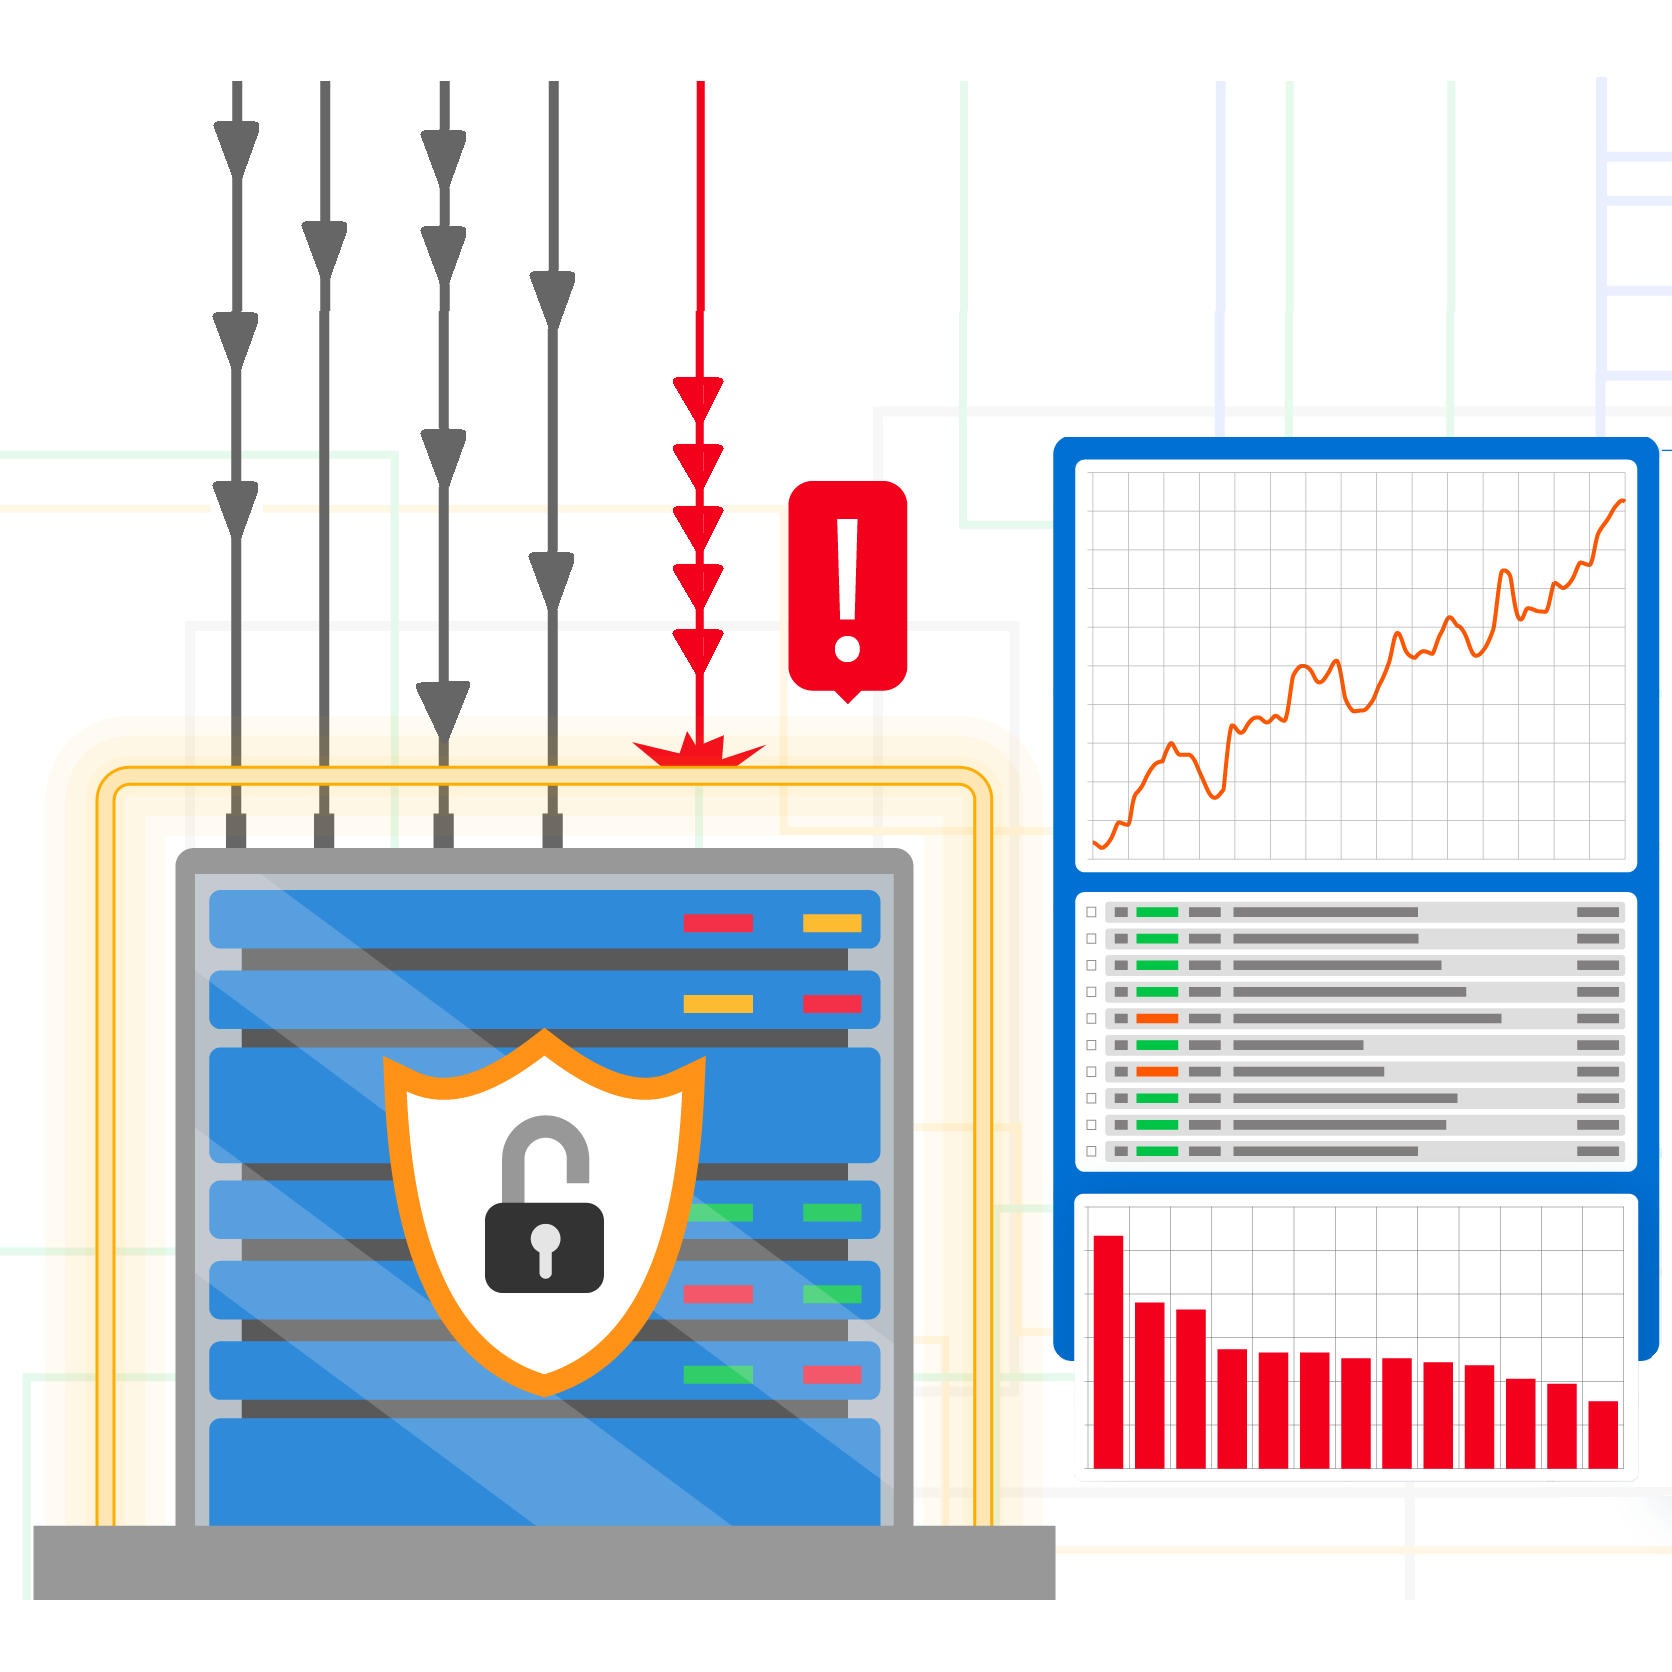
To ensure security of the data, aceess to various plots and features has been limited as per the department and rank of the user logged in. Department and region wise plotting of data along with the functionaity of custom graphing has been enabled.
The dashboard allows for data Filtering according to time interval, city, stations or other department‑specific parameters for improved visual analysis. A report comprising of all the plots on the current page can also be downloaded as a .pptx file.
The intercative indiviual graphs allow for zoom in, zoom out, scale change, (de)selection of categories in multi-graphs and may indiviually be downloaded as a .png with transparent background.
Github Link